Frequently Asked Questions - Answered
EconoLux Industries answers your frequently asked questions about our products and
also about horticultural lighting.
|
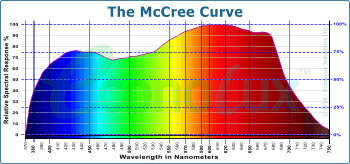
What Light Do Plants Need? The potion of the visible light spectrum typically used by plants lies between 350 nanometres (nm), UVA/deep blue, and 750 nanometres, deep red/ infra red. The portion between 400nm and 700nm is known as Photosynthetically Active Radiation or PAR. Within the 350~740nm region, various photosensitive pigments within the plants have absorption peaks of differing amounts at different wavelengths. The various absorption peaks can be averaged into an overall curve showing the spectrum of light that most plants need for proper growth. This curve is called the McCree curve. |
 |
|
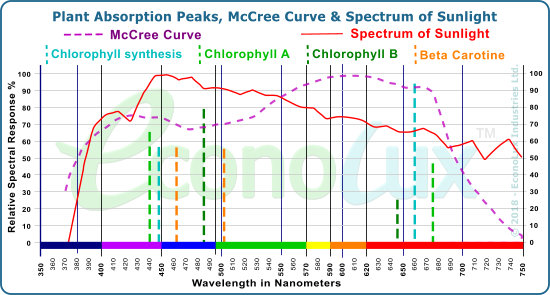
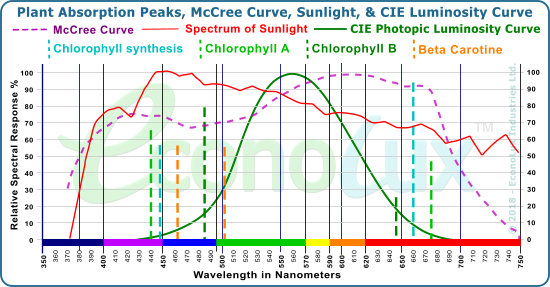
The graph (on the right above) shows the various absorption peaks of the main substances in plants which
require light, as well as the peaks of the light needed for the plants to make chlorophyll (as
dashed vertical lines). The McCree curve (dashed purple line) is the average of the spectral
needs of plants, which shows that plants primarily need blue and red light, and slightly
less green & yellow light. The spectrum of Sunlight (red line) is overlaid for reference as any horticultural light is trying to mimic the sun. The more modern measurement is the McCree curve, first proposed by Dr. Keith McCree in the 1930's - the McCree curve is the pink dashed line in the graph above. EconoLux Industries has a comprehensive section called "What Light Do Plants Need?", which includes link to a PDF version of the paper the section is based on.
|
|
What is the McCree Curve? The McCree Curve quantifies the average photosynthesis response of plants to light from 350nm to 750nm, and shows the average sensitivity of plants to light (the plant sensitivity curve) in this region of the spectrum. The McCree curve can be used to compare the spectral output of a plant/grow-light with. the average photosynthetic sensitivity curve for plants. We have a section just about The McCree Curve. |
 |

|
|
|
How do you measure Grow/Plant light output? Lumens: Many manufacturers of plant growing lights (MH, HPS, LED, and Induction), quote the output of their lamps in Lumens. This is a measure of the amount of Lumens a light is producing according to the 1951 CEI Photopic Luminosity curve. However, the CIE Luminosity curve used in the Lumens measurement applies to light sources designed to produce light for human vision (which is more sensitive to green light), not to agricultural/plant lights! Thus the Lumens figure, when applied to plant/grow-lights, can be very misleading and even deceptive. |
|
|
The graph (on right) shows the CIE Photopic curve (green line) overlaid on the McCree Curve (dashed purple
line). You will note that the CIE curve has its peak around 555nm and falls of sharply in the blue region and the red region. Lumens are measured according to the sensitivity of the human eye (CIE curve), not the photosynthetic responses of plants, thus Lumens is NOT a suitable way to measure the performance of horticultural grow-lights. Lumens are for Humans! |
 |
|
PPFD: Lighting for plants is different from lighting
for humans. Light energy for humans is measured
in lumens, with light falling onto a surface measured as illuminance with units of lux (lumens per
square meter) or footcandles (lumens per square foot). Light energy for plants, on the other hand, is measured as photosynthetic active radiation (PAR), with light falling onto a surface measured as photosynthetic photon flux density (PPFD). - http://docs.agi32.com/AGi32/Content/adding_calculation_points/PPFD_Concepts.htm Since a properly designed grow/plant light produces primarily blue and red light, its going to have a low lumen output (due to a reduction in green light). High lumen numbers are a waste of energy and money! High lumen numbers show the lamp is making plenty of green light, light that is not as useful to plants. PAR: When measuring plant-light output, the correct unit of measurement for proper evaluation is to measure in Photosynthetically Active Radiation (abbreviated to "PAR"), using a PAR meter (quantum flux meter); or to measure in PPFD (Photosynthetic Photon Flux Density). Measuring in PPFD/PAR gives a much more accurate comparison of the light energy produced by a grow/plant-light lamp, and the amount of light useful to plants that the plant/grow lamp is producing. EconoLux provides grow-light output values in PAR and PPFD. Remember: Lumens are for Humans - PAR/PPFD are for Plants!
|
|
What are the various plant growing light curves? The two major plant light absorption curves are the older PAR curved that was measured "in vitro" (in a glass container), and the McCree curve which is more modern science and was measured "in vivo" (in live plants). Many manufacturers of "grow lights", especially the cheaper dual band and quad band type, and even some well known brands, don't provide the spectrum of their lights, or if they do, they make it hard to find. Few vendors provide the PPFD spectrum or a comparison of their spectrum with the well know plant light sensitivity curves (such as the McCree curve). The top professional grow light manufacturers provide there spectrum and often a comparison to plant absorption curves. For a plant-light, it is important to produce a spectrum that fits within the McCree curve or the spectrum of sunlight, (as closely as possible) as any excess light produced outside of the McCree curve spectrum, is simply wasted light, thereby reducing the the overall efficiency of the plant/grow-light. However, it is well known that plants, in the germination and vegetative phase of their growth, need more blue light, while plants in the budding/flowering/fruiting phase need more red light. To complicate matters further, certain types of plants, for example Red Leaf Lettuce (Lactucasativa L.) do not require a lot of red light, but do require some UV light during certain phases of the growth cycle. This has lead to a proliferation of plant/grow-lights, with different curves, designed to work with specific plant types. |
|
Sunlight: A base-line comparison to the Sun is useful as sunlight is the most prevalent, and natural source of light for growing plants. All other horticultural light sources are essentially, to a greater or lesser degree, are trying to mimic sunlight. The graph (on the right) shows the McCree curve (dashed purple line) and the visible (350nm to 750nm) portion of the spectrum of sunlight at noon (as a solid red line). Sunlight does not closely follow the McCree curve, although the McCree curve is a closer match to sunlight than other plant-light curves. |
|
|
|
|
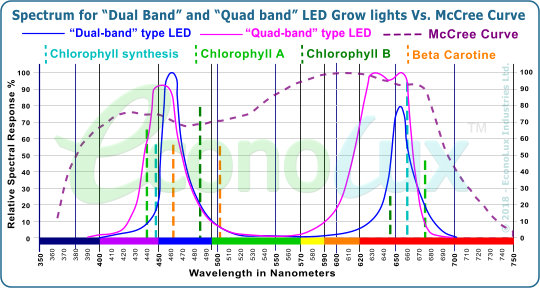
What is the meaning of "bands" when discussing LED grow-lights? When LED plant/grow light vendors talk about 'bands" they mean the number of different wavelengths of LED(s) that are used. The most cheap and basic LED grow lights usually have only 2 to 4 bands. This means that there are usually either one band (wavelength) each of blue or red LEDs (dual band), or 2 different wavelengths of blue LEDs and two different wavelengths of red LEDs (quad band). This is done to reduce costs in the dual band models, and in the 4 band models to broaden the peaks of the blue and red by choosing LEDs with adjoining wavelengths (such as 630nm and 660nm LEDs) While these dual/quad band lights can grow plants, particularly where they are used for supplemental lighting, they lack the spectrum plants really need, and they have have a poor match to the McCree curve as you can see from the graph on the right. |
 |
|
|
|
How to measure Grow/Plant light Efficiency How best to quantify the efficiency of plant/grow lights? Efficiency is the amount of light output provided by a light source, compared to the electrical input. Lumens/Watt is an example of a widely implemented efficiency standard used in lighting for human occupied spaces, but as we have seen above, Lumens are not relevant to plant/grow lighting. |
|
μmol/J The most used standard for measuring grow/plant light efficiency in the professional horticulture
industry is μmol/J (Micromoles per Joule). This quantifies the efficiency of the grow/plant light in terms
of micromoles (PPFD) per Joule (unit of electrical energy). This number is independent of distance from
the light source as it's a measure of electrical efficiency; how much light in micromoles is being
produced with a certain amount of electrical energy. For the best measurements, YPFD (Yield Photon Flux Density) should be used. This quantifies PAR/PPFD in terms of light energy rather than photons, which is dependant on the spectrum, as different wavelengths of light have different energy densities. Since mostly the high-end manufacturers selling to professional greenhouses publish their μmol/J rating, and others only publish PAR/PPFD readings, what is needed is a simple way to compare grow/plant light efficiency for pro-sumer and consumer grade grow/plant light products. |
 |
|
PPFD/Watt We proposes using PPFD/Watt as a comparative measurement. The rational for this is as follows: [1] All of the serious manufactures of grow/plant light products publish their PAR/PPFD readings; generally they provide the average PAR reading but some publish more detailed grid charts with multiple readings. Any manufacturer who can't provide their output in PAR/PPFD is suspect and should be avoided. [2] All of the serious manufactures of grow/plant light products publish their actual power consumption figures in watts (as measured at the wall plug/electrical connection) - including any driver overhead. Any manufacturer who can't provide their power consumption in actual watts (rather that just the nominal wattage) is suspect and should be avoided. [3] The only "fly in the ointment" with the PPFD/Watt measurement is that the distance from the fixture where the PAR/PPFD was measured has to be the same (or very close) in order to get a valid comparison, unlike the μmol/J rating which is distance independent. However, even with this minor drawback in the PPFD/Watt measurement, it still allows one to make a reasonable comparison between grow lights of different wattages and spectrums. - as long as one has the average PAR/PPFD reading at the same distanced form the light sources, and and the actual wattages are given as power consumed from the wall plug (so that ballast/driver overhead and any fans or electronics are included).
For example, an HPS grow light vendor gives the average PAR as 631 at a distance of 61cm (24 inches), and the total
power draw as 1,065 Watts. A LED grow light vendor gives
their average PAR as 124 at a distance of 61cm (24
inches), and the total power draw as 320 Watts.
|
|
What are the different categories of LED plant/grow-lights? Horticultural lighting van be categorized by the type and formula of LEDs that are used. These combinations of LEDs are determined by the vendors based on desired spectrum, or minimizing the cost the cost and in creasing the profits of the product: |
|
Blue/Red: We have already mentioned dual band and quad band LED grow lights above. These are the moist common type and emit a pinkish light, made up of Blue and Red LEDs. These are usually the simplest and cheapest type of grow-lights and are based on the theory that they provide the essential light for chlorophyll. They have a very poor spectrum (compared the the McCree curve) as you can see from the graph below.
|
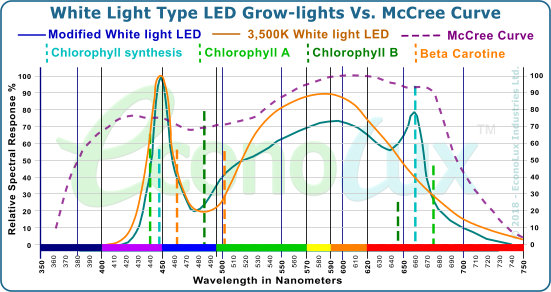
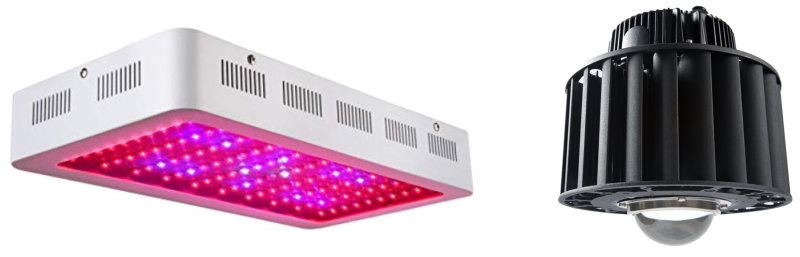
White Light and modified white light types: There are a number of
vendors who offer white-light LED based grow lights. These
are simple and cheap to make as white light LEDs are cheap
and ubiquitous since multiple factories churn our hundreds
of thousands per day. Some vendors combine white light LEDs with other LEDs (usually red as the white light types are deficient in red) to created modified white light types of grow light. Below is the spectrum of a 3,500K white light type, and a popular US brand of modified white-light LED grow light, Vs the McCree Curve.
|
|
|
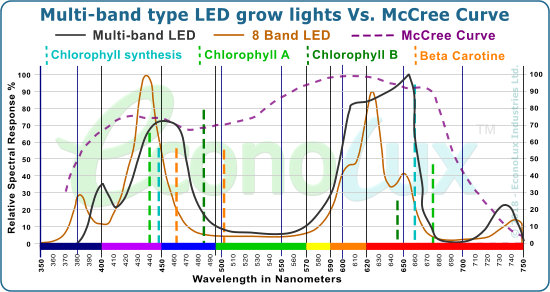
Multi-Band type LED Grow Lights: These types of
lights use 7
to 10 (or more) bands of LEDs to create a better spectrum that other types of LED grow
lights. Some vendors even include a few white light LEDs to improve the spectrum further. As you can see from the graph below, while these types of multi band grow lights have better spectrums than other types, their spectra are still not a close match to the McCree curve.
|
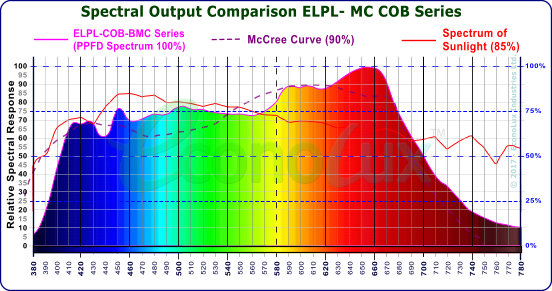
McCree Curve Types: These types of LED grow lights use 20 to 24
bands of LEDs to create a spectrum
that is very close to the McCree curve. At this time, there is only one manufacturer, EconoLux, that offers
McCree curve plant/grow lights with a match from and 80% match to a 95% match to the McCree curve. As you can see from the graph below, the ELPL-Mc Cob has a 90+% match to the McCree curve.
|
|
|
|
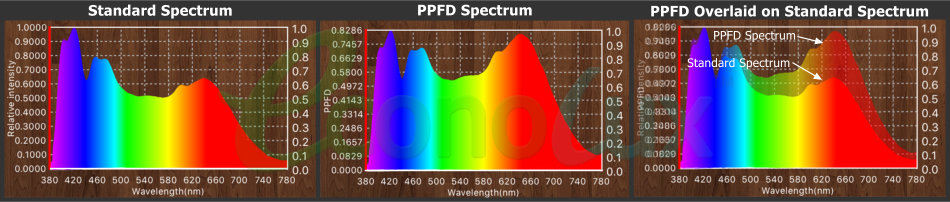
What is the difference between the regular spectrum and the PPFD spectrum? Generally when manufacturers provide the spectral curve of their plant/grow lights, they usually provide the standard/normal spectrum (as the human eye sees light). The PPFD spectrum of a light source is made in accordance with PPFD measurements - the way plants "experience" light. The PPFD spectrum of a light will show a little less blue light and more red light than a standard/normal spectrum, but it is a better way to predict photosynthesis. The graphs below, taken from our plant-light spectrometer, show the standard/normal spectrum (as the human eye sees light) on the left, the PPFD spectrum (as plants experience light) in the center, and a comparison of the standard spectrum and the PPFD spectrum overlaid, to better illustrate the differences. You will note that in the PPFD spectrum, the blue portion of the spectrum is slightly depreciated (shown as less than the standard spectrum), while the orange and red portion of of the spectrum is enhanced over the standard spectrum.
|
|
|
|
What is the difference between active and passive cooling of LED plant/grow lights? An actively cooled horticultural light usually has some means, usually fans, to remove heat. In some cases, grow lights may use flowing water which is sent to radiators or chillers for cooling. These lights have moving parts (fans) which are subject to occasional failure, and they require maintenance or cleaning. They also have the disadvantage of being noisy and are generally not water resistant of waterproof. A passively cooled system relies on a heat-sink (or heat-sinks) to radiate away heat without any moving parts (fans). These may be simple extruded housings with fins on the back, to more complex systems that use heat-pipes to convey the heat from the LEDs to the heat-sinks. Passively cooled lights have the advantage of being low maintenance, generally water resistant or waterproof, and silent.
Right: The EconoLux McCree curve PRO-LED grow light which uses heat pipes linked to the heat-sink above the COB for passive cooling. |
|
|
|
What is the best plant to lamp distance? There is really no hard and fast rule or exact plant-to-lamp distance. Some guidelines are that you always want to have the lights as close to the plants as possible, without heating the plants. You also want to have the lights close to the plants while providing the best coverage area. If you have a PAR or PPFD meter, then you can measure the levels to determine the amount of light you can provide without heating the plants. General recommendations are 250~400 PAR/PPFD for seedlings, clones and germinating plants; 400~600 PAR/PPFD for leafy green or vegetating stage plants; and 600!850 PAR/PPFD for the flowering or or fruiting stage of plant growth. GUIDELINES FOR LIGHTING OF PLANTS IN CONTROLLED ENVIRONMENTS - NASA-CP-95-3309
|
|
What are some meaningless metrics when it comes to grow lights? Some vendors offer statements or information about their grow/plant light products that are unhelpful or essentially useless. Some examples are: Lumens/Watt (L/W): Lumens are for humans - As has been previously discussed, lumens are measured according to the sensitivity of the human eye, whereas PAR/PPFD is measured with a different curve which takes into account photosynthetic sensitivity. Lumen output, Lux output, or Lumens/Watt don't tell you anything about the levels of Photosynthetically Active Radiation a light source is producing. Some vendors still include these figures because they are easy to derive and because they have been customarily provided over the years, and are only recently being replaced by more useful PAR and PPFD readings. CCT (Correlated Colour Temperature): The correlated colour temperature (CCT) is a specification of how colour appears under the light emitted by a lamp, and is measured in degrees Kelvin (K). The CCT rating for a lamp is a general "warmth" or "coolness" measure of its appearance. This is NOT a useful metric for plant/grow lights as it relates to how the human eye perceives the "warmth" or "coolness" of a light source. The only bit of information that can be derived from the CCT (as a guideline) is that the lower the Kelvin number, the more red light is being emitted, and the higher the Kelvin number the more blue light is being emitted. Penetration: Many vendors use phrases such as "good penetration" or "excellent penetration" as some kind of metric that is supposed to tell you how well the light penetrates the pant canopy. This is a useless marketing phrase as there is no scientific test for "penetration".
|
|
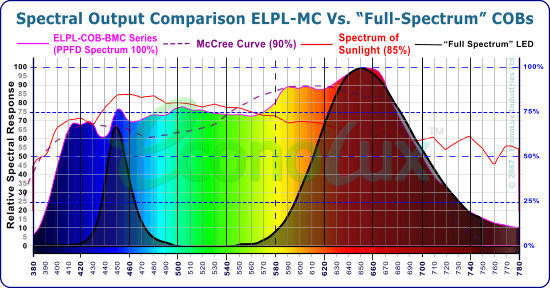
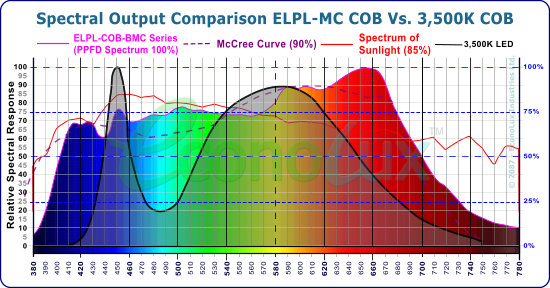
What is the difference between the ELPL-COBs and other LED grow light COBs on the market? There are many "grow-light" LED COBs on the market, with most of them at a much lower price point than the EconoLux COBs. Some of them offer a limited number (4~6) of bands, while some offer 8~9 bands of LEDs, some are "white light" COBs, and some claim to be "full spectrum" COBs (see comparison graphs below). The 4 to 9 band types are made this way to lower production costs, as the fewer different wavelengths used (bands), the lower the cost to manufacture. The so-called "Full spectrum" types are basically blue (450nm) LEDs coated with red phosphors and are not really full spectrum. In most cases, the spectrum produced by these cheaper COBs is inadequate, with a limited amount of blue light, and usually an over abundance of red light. Typically these COBs were not produced based on scientific research, but rather on a "best guess" approach, or in the case of many vendors, copying other's designs. If price/budget is a major concern, then we suggest that you purchase a 3,500K white-light COB as these will be the best choice among the cheap COBs, with a match of usually around 60~64% to the McCree curve. The ELPL COB series of LED grow light engines is designed to produce the maximum of PAR/PPFD light - light useful to plant growth. with a real full spectrum from 390nm to 750nm. In the case of our ELPL-Mc-COB (McCree curve COB), the spectral curve has been engineered with an unheard of 24 bands (wavelengths) of LEDs, to obtain a 90+% match to the McCree curve. This approach insures that the EconoLux plant/grow light COBs provide the best spectrum, in accordance with established scientific research. In the case of our VXS COBs, the spectrum has been engineered to produce a match of 85% or more to the McCree Curve. The EconoLux COBs are an industry first as the are the only COBs that produce such a close match to the McCree curve (see spectrum comparison charts below). |
|
Comparison of the spectrum output of the ELPL-Mc COB vs. a typical so-called "full spectrum" COB, which as you can see, is not really full spectrum at all. |
Comparison of the output spectrum of the ELPL-MC COB and a 3,500K "white light" COB, which has a better spectrum but still not a good match to the McCree curve. |
|
|
|
Why are your ELPL-Mc COB LEDs so costly? Naturally, high quality COBs such as the EconoLux ELPL-MC COBs are more expensive than typical LED grow light COBs, on the market, especially the so called "full spectrum" type, and the mass produced white-light COBs, due to a number of factors: |
|
► We use high quality imported BridgeLux and EpiLED chips from Taiwan, not cheap domestically produced LED chips. ► When a batch of chips arrives at the EconoLux factory, each individual chip is tested to insure that it is the specified wavelength (+/-2%) - a time and labour intensive operation. |
||
|
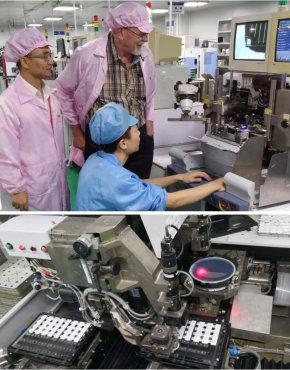
► We use 22 or 24 different wavelengths (bands) of LED chips to make our COBs. The more wavelengths (bands) that are
used, the more costly it becomes to produce the COB, especially when some of those wavelengths are non-standard
and have to be specially ordered. ► The Pick & Place machine (see photo) used to assemble the COBs requires several passes to assemble the COB, another time and labour intensive operation. ► Part of our COB is coated with our proprietary phosphors. This means we have to assemble that part of the COB first (including wire-bounding), then coat it with the phosphor and leave it overnight to cure, before inserting the remaining un-coated LED chips. ► EconoLux uses 99.99% pure gold wire for wire-bonding our COBs. Other manufacturers use cheaper 99.9% gold wire, and some even use aluminum wire to cut costs. ► Each COB produced is "aged" for 12 hours (operated at full power for 12 hours). Then each COB is tested to be certain that the spectrum is as expected (within +/- 2.5%),before being packed for shipping. |
 |
|
|
It is this devotion to excellence that has enabled EconoLux Industries to create the world's first HG
(High Granularity) multi-band, 100W, LED COB that has a 90+% match to the McCree curve. Please see our LED production facility video at https://www.youtube.com/watch?v=UEZeOdE3PJ4
|
|
How does the spectrum of the ELPL-Mc COB compare to HPS and MH lamps? The EconoLux ELPL-Mc COBS have a 90~95% match to the McCree curve, while the ELPL-VFX COBs have an 80~85% match to the McCree curve. Thus both COBs produce a much better spectrum than either Metal Halide (MH) or High Pressure Sodium (HPS) lamps. The graphs below shows the comparison: |
.jpg) |
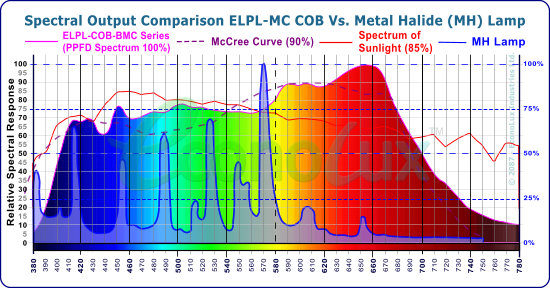 |
As you can see from the graphs, the two most popular HID lamps used for horticulture (HPS and MH) produce light as a series of 'spikes' not a smooth spectrum, with a lot of green and yellow light. The HPS lamp spectrum is severely deficient in the blue and red portions of the spectrum, while the MH lamp has more blue 'spikes' but is still severely deficient in the red portion of the spectrum Both types of lamps have a vary poor match to the McCree curve, while the ELPL-MC COB has a smooth full spectrum (from 380 to 750nm), and 90~95% match to the McCree curve.
|
How much energy can you save by replacing MH and HPS lamps with EconoLux LED grow-lights? First you have to consider the existing lights, and then determine the best replacement LED lights. The simplest way to do this is to work on a wattage bases, where the rule of thumb is to replace HID lights with 70% to 75% of their wattage of LED lights. (There are some vendors on the internet who say you can replace with 50% LED wattage... which you can, but the PAR/PPFD will probably be insufficient.) For example, if the installation is using 1,000W HPS lamps (very common in commercial greenhouses), we recommend that they be replaced with 700~750W of our LED lights (EG: 1 piece of ARANHA-670 lights or 7 pieces of PRO-LED-100W). On that basis, the HPS lamp is using 1,160W of power (when ballast overhead is considered), and the ARANHA-670 consumes 703W (when driver overhead is included). Thus the energy savings would be 39.3%. This is typical of the type of savings that can be expected, which are generally in the range of about 25% at a minimum, to around 40% at the maximum, while still providing sufficient PAR/PPFD for the plant's needs. |
PRO-LED Series
ARANHA 670W & 1,000W Series Grow Lights
GroFlux 330W & 530W Series Grow Lights
VertiFarm 40W & 60W Series Low-profile
Home-Grow Lights
OEM & Custom LED Grow-lights
Knowledge Case Studies
What Light Do Plants Need?
The McCree Curve
Distributors/Where to Buy
Phone:
+86-185-7642-7529 (English only)
+86 186-2168-9926 (English & 中文)
Lighting![]() EconloLuxIndustries.com
EconloLuxIndustries.com