What Light Do Plants Need?
LED grow-lights come
in various different types, from the cheap '2-band' Blue/Red type, to modified
'white-light' types (White + Red LEDs), to so-called 'full spectrum' types, to variable
spectrum types. How to make sense of what lights you need to grow healthy
plants with high crop yields in your professional greenhouse, vertical farm set-up, or your home? Read on to discover what
light plants actually need.
|
Abstract
Agricultural (or Horticultural) lighting (plant/grow lights), are widely used in greenhouses, with and without
glass walls/ceilings, and in other locations for example, grow tents or indoor controlled environments with
no natural daylight; to either replace, or augment, natural sunlight (daylight) in the growing of many
different types of crops. These crops may include, peppers, tomatoes, leafy greens,
micro-greens, basil and other herbs, lettuce,
flowers, Cannabis or other medicinal plants.
In many cases, the most popular type of lights used are HID (Metal Halide or High Pressure Sodium) lamps. These
lamps are generally deficient in spectrum of the light delivered to the plants, and the electrical energy needed
to operate the plant/grow-lights accounts for a significant amount of the input costs involved in the production of the crops,
plus there are additional cost incurred though the HVAC
systems needed to remove the heat produced by the HID lights.
This paper discusses the various curves used to quantify the light spectrum that is most desirable for plant cultivation with
artificial lighting, including the research its based on. The information provided herein relies on publically available scientific research, and references are
provided where they are available.
The full paper is available as a PDF file from the link below and is
freely distributable provided the copyright notice(s) remain
intact.
Introduction
In many locations, artificial lighting, plant/grow lights, are used for the production of agricultural crops
such as vegetables or flowers. The plant/grow-lighting is used for a number of reasons:
|
| |
► In a greenhouse setting where natural light is present
(E.G.: from a glass roof), seasonal variations in the hours of daylight available
may require artificial lighting to augment the natural light (daylight "bookends", or "daylight-extension")
- this is usually in more northern and southern latitudes where seasonal daylight hour variations are greatest..
► Even when abundant natural light is available, it may be desirable to use artificial lighting to
extend the number of hours of light exposure the plants receive, in order to "force" growth, to increase
crop yields, or to shorten the growing cycles.
► The use of artificial lighting allows for plants to be grown in locations where no existing natural light is
available such as in underground or enclosed locations, or in places such as the arctic, where the ambient environment is
hostile to the growth of many types of plants.
► The use of artificial lighting also allows some kinds of plants to be grown in regions where existing sunshine
is too plentiful and the heat of the sun would dry out, or burn, the plants.
► Artificial lighting, in an enclosed location where no natural light is allowed to enter such as a
"Food Factory" or Vertical Farm, also allows for control of many other variables such as humidity, CO2
concentrations, etc., so as to provide optimum and controlled conditions for the cultivation of specific plant types.
► In a controlled environment, artificial lighting can also allow for changes in light levels (intensity), or
light output spectrum, so as to more closely tailor the lighting conditions to the plant's requirements.
|
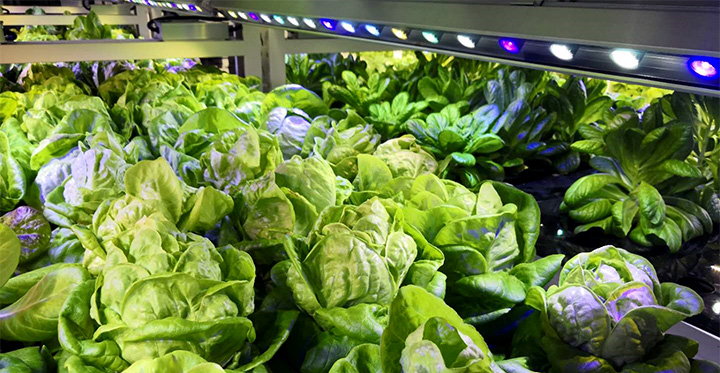
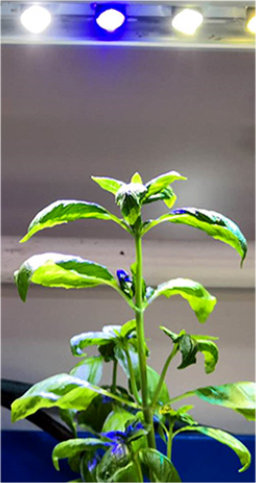
Lettuce in a vertical farm growing under EconoLux LED grow-lights
|
What Light Do Plants Need?
Light, which is a form of energy, is used by plants for producing food through the process of photosynthesis. The spectral
composition of the light in the plant's environment is used to activate pigment cells (coloured cells in the plant). The
light affects the developmental aspects of the plants such as size, proportion of shoots to roots, flowering/fruiting, etc.
The spectrum of light typically used by plants lies between 370 nanometres
(nm) (UVA/very deep blue) and 750 nanometres (nm) (Infra Red). The portion of the spectrum that
lies between the 400nm and 700nm wavelength region is known as Photosynthetically Active Radiation or PAR.[1] Generally
speaking, plants also make some use of light in the region between 380nm and 400nm, and between 700nm and 750nm,
which includes UVA, and Infra Red light. Some plants also make use of light in the UVB region for coloration development.
|
|
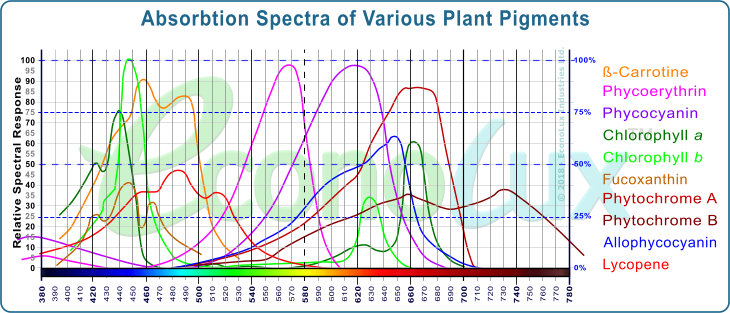
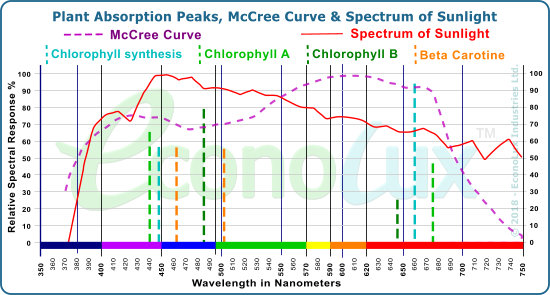
The graph on the right shows some of the absorption peaks of the major photosensitive substances in plants which
require light. This is a selection of the major light absorbing pigments and is not intended to be exhaustive as it
ignores many of the so-called "antenna pigments". The graph is provided to show that
the light needs of plants are complex and span the full spectrum from 380nm to 780nm. |
 |
|
|
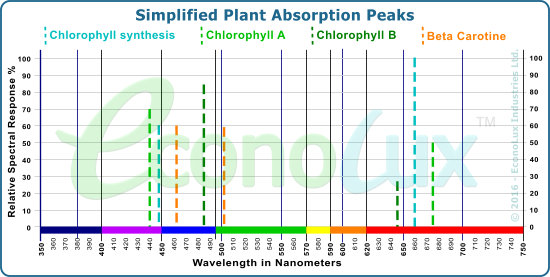
Generally speaking, most grow-light manufacturers are only talking into account the
most basic of the plant absorption peaks - which is why you
see so many pinkish (blue & red LEDs) grow-lights.
Those peaks are the Chlorophyll synthesis peaks, Chlorophyll A
peak, Chlorophyll B peak, and Beta Carotene peak.
On the left is a graph showing this simplified view of plant's light absorption peaks,
using coloured vertical dashed lines. These lines give the
relative spectral response of the peaks by variations in their
height. |
|
The PAR Curve [1]
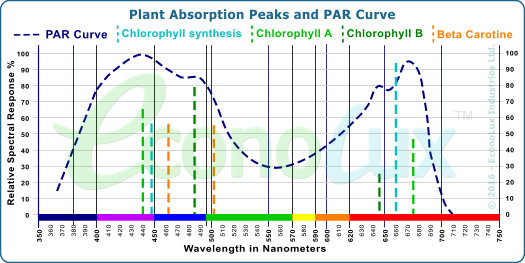
We can average out this simplified peak information, and plot it into a generalized curve, which indicates
a basic spectrum of light that plants need. This curve is called the PAR curve and is the oldest and still
a popular way of determining the light spectrum that plants need.
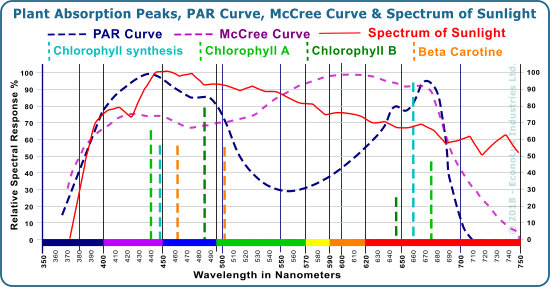
On the right is a graph of the PAR curve (dashed dark blue line), plotted from the plant absorption peaks,
as well as 'in vitro' measurements of plant absorption.
|
 |
|
Note that in reality, the PAR curve is an average of the light absorption
needs of plants. In actual fact, different plants have slightly different PAR curves as the different species absorb
light in different ways. In order to provide the PAR curve we are using in our graphs, we averaged the PAR curves from
a number of different plant types, obtained from various sources.
You will note that the PAR curve has its peak (100%) in the Blue region, around 440nm, and another, lower, peak in the red
region around 675nm. You can also see that (according to the PAR curve) the plants don't use much of the light in the
green region from 540nm to 570nm (the "trough" of the PAR curve). The PAR curve ignores the
importance of the "sieve effect".
This is why most plants appear green to the human eye, because mutch of the green light hitting the plant is reflected,
while the blue and red light is absorbed by the plants to make nutrients.[4][4A]
Plants make use of the blue portion of the spectrum (as its more abundant in sunlight
compared to the orange/red
wavelengths), for the higher energy levels provided by the shorter blue wavelengths. Plants make use of the red
portion of the spectrum, even though that has lower energy levels, due to the abundance of orange/red wavelengths
available in sunlight. According to the PAR curve, the plants make more use of the blue light as the PAR curve peaks at 440nm (100%), while
the red peak at 675nm only reaches 95%. According to the PAR curve, plants prefer to have slightly more
blue than red light generally speaking.
The blue portion of the spectrum is used by plants for root, stem and leaf formation, while the red portion of
the spectrum is used mainly for chlorophyll synthesis and during the flowering and fruiting phase of plant growth.[4]
|
|
Sunlight |
|
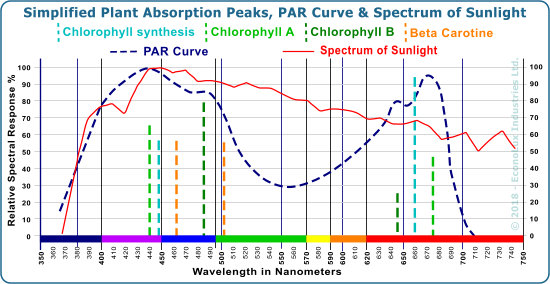 |
A comparison to sunlight is always useful as sunlight is the most prevalent, and natural, source of light for growing
plants. All other horticultural light sources are essentially, to a greater or lesser degree, trying to mimic
sunlight.
The graph on the left shows the PAR curve (dashed dark blue line), and the visible portion (350nm to 750nm)
portion of the spectrum of sunlight at noon[4] (solid red line). Sunlight does not closely follow the PAR
curve, as can be seen from the graph.
|
|
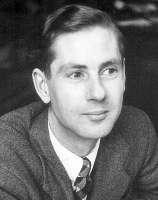
The McCree Curve [3]
In the 1970s, Dr. Keith. J. McCree, who was a professor at Texas A&M University in the Soils and Crop Sciences
department and a physicist by education, published a seminal paper entitled "The action spectrum, absorptance
and quantum yield of photosynthesis in crop plants". |
Dr. Keith. J. McCree |
To quote from the abstract of the paper: "The action spectrum, absorptance and spectral quantum
yield of CO2 uptake were measured, for leaves of 22 species of crop plant, over the
wavelength range 350 to 750 nm. The following factors were varied: species, variety, age of leaf, growth
conditions (field or growth chamber), test conditions such as temperature, CO2 concentration, flux
of monochromatic radiation, flux of supplementary white radiation, orientation of leaf (adaxial
or abaxial surface exposed). For all species and conditions
the quantum yield curve had 2 broad maxima, centered at 620
and 440 nm, with a shoulder at 670 nm. The average height of
the blue peak was 70% of that of the red peak."[3]
|
|
This peer reviewed study was one of the most detailed on plant light absorption and is still referenced and cited today.
From his study data of 22 species of crop plants, Dr McCree was able to create a generalized plant light absorption curve (the same principal as
the generalized PAR curve) which is known as the McCree curve, and looks like this graph on the right (dashed
purple line).
As you can see, the McCree curve based on "in vivo" science
measured with live plants,
is considerably different to the "in vitro" PAR curve. |
 |
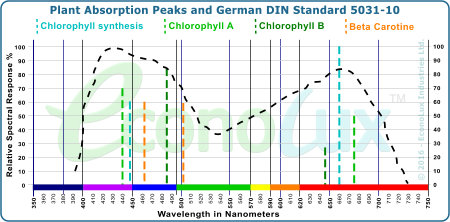 |
Other Plant Light Absorption Curves
There are some other plant light absorption curves in use, but the PAR curve is still
fairly popular, followed by the McCree curve which is gaining ground.
For example there is the German DIN Standard 5031-10 curve, which is shown on the left (dashed black line). This
curve is somewhat similar to the PAR curve, but is is not widely used in the horticultural industry. |
|
Once again, a comparison of the McCree curve to sunlight is useful. As mentioned before, sunlight is the most
prevalent, and natural, source of light for growing plants. All horticultural light sources are essentially,
to a greater or lesser degree, trying to mimic sunlight.
The graph on the right shows the McCree curve (dashed purple line), and the visible portion (350nm to 750nm)
portion of the spectrum of sunlight at noon[4] (solid red line). You will note that the match between
the spectrum of sunlight and the McCree curve is much closer than the match to the PAR curve.
|
 |
|
Comparison of the PAR curve, the McCree Curve, and Sunlight |
 |
This graph shows a comparison between the the PAR curve (dashed dark blue line), the McCree curve (dashed purple
line), and the visible portion (370nm to 750nm) portion of the spectrum of sunlight at noon [4] (solid red line).
While the DIN curve and the PAR curve are somewhat similar, the McCree curve is quite different from the PAR
curve.
Compared to the PAR curve, the McCree curve shows plants need more UV light, less blue light,
make more use of the light in the 520nm (green) to 620nm (orange) region, and also need
slightly more deep red light
(compared to the PAR curve). |
|
This is not surprising as the PAR curve was mostly determined "in vitro" - dissolving leaves in a
glass test tube of solvent.
On the other hand, the McCree curve was determined "in vivo" - measuring the response of live leaves. In addition,
Dr. McCree measured the response on both the front and back (adaxial
and abaxial surfaces) of the leaves, and measured the
response of 22 different types of crop plants, which he then averaged to produce the McCree curve. Thus the McCree
curve is the best publically available scientific data on the light needs of plants.
Note that the above graph shows sunlight provides an
abundance of green to yellow light in the 470nm to 590nm
range, even though the plants don't absorb much of these
wavelengths (according to the McCree curve). This
"overabundance" of certain wavelengths (colours) is not a
problem for the plants, as they absorb only as much light in
the blue, green, yellow, orange and red wavelengths as they
need, and simply ignore the rest. However, for an artificial
plant/grow-light, it is important to produce a spectrum that
fits the McCree curve, (as closely as possible), or ideally
the spectral curve of sunlight, as any excess light
produced, or light produced outside of the McCree curve
spectrum, is simply wasted light. The 'wasted' light
represents energy being used producing that light, which the
plants don't need, thereby reducing the overall efficiency
of the horticultural/plant/grow-light.
|
 |
|
Despite the science represented by the McCree curve, it is also well known that plants in the germination and vegetative
phase of their growth, need more blue (high energy) light, while plants in the budding/flowering/fruiting phase need
more red (lower energy) light. To complicate matters further, certain types of plants, for example Red Leaf Lettuce
(Lactuca sativa L.) do not require a lot of red light, but do require some UV light during certain phases of the growth cycle.
Thus, there is not one type of plant/grow-light which can accommodate the needs of all types of plants, even if it produces a
90% or more match to the McCree curve. This has led to a proliferation of plant/grow-lights, many
of them with variable spectrums, designed to work with
specific plant-types.
|
|
Measuring Light for Plant Cultivation
Many manufacturers of plant-lights (MH, HPS, LED and others), quote the output of their lamps in Lumens (and
sometimes Lumens/Watt [L/W]). This is a measure of the amount of Lumens (measured according to the 1951 CEI
Photopic Luminosity curve[6]), that a light source is producing.
This is a very standard way of evaluating the output efficiency/performance of light sources, used in illuminating
spaces for humans. However, the CIE Luminosity curve used in the Lumens measurement applies to light sources
designed to produce light for human vision, not to agricultural/plant lights! Thus the Lumens figure, when
applied to plant/grow-lights, can be very misleading and/or deceptive.
|
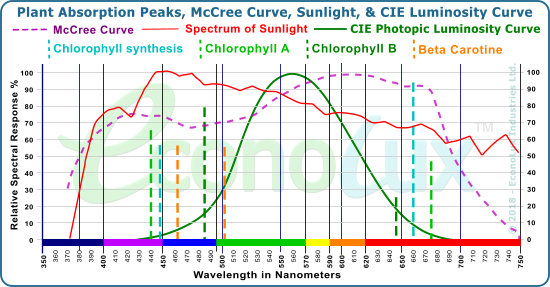 |
The graph (left) shows the 1951 CIE Photopic curve (green line) overlaid on the McCree curve (dashed purple line), the
plant absorption peaks (dashed vertical lines), and the
spectrum of sunlight (solid red line). You will note that
CIE curve has its peak around 550nm (green), which is the point at which the human eye is most sensitive to light.
As we know from the McCree curve, plants have the peak of
their sensitivity at 2 broad maxima, centered
at 440nm and 620nm, with a shoulder at 670nm, with the average height of the blue peak at 70% of the red peak.
|
|
If a manufacturer wanted to improve their Lumen figures to make their plant/grow-lights seem like they have
more output, then they could adjust the lamp spectrum so that they have more green and yellow output, to inflate
the lumen (and L/W) numbers.
Lumens are for Humans!
Lumens are not a suitable way to measure the performance of plant/grow-lights, since a grow light producing
primarily UVA, deep-blue, blue, orange and red light is going to show a low lumen output, due to lack of green. The
reason why many manufacturers provide Lumen (and L/W measurements) is because integrating spheres have these functions built
into them, or a simple and cheap light meter can be used, so it's easy to get Lumen test results. They lack the more
expensive plant-light spectrometers that can provide PPFD, YPFD, and DLI [5] readings.
CRI (Colour Rendering Index)
Similarly, many manufacturers quote the CRI or RA of their grow-lights. CRI (Colour Rendering Index) is a quantitative
measure of the ability of a light source to reveal the colors of various objects faithfully in comparison with
an ideal or natural light source (such as the sun).
This measurement is totally irrelevant to agricultural lighting (grow-lights), except under
circumstances where
humans need to inspect the plants. The plants are more concerned with the spectral make-up of the
grow-light source, rather than if if renders colours properly. As an aside, a grow-light with a 90+% match
to the McCree curve will have a CRI of around 9194 (the best possible CRI number is 100). One can always
use a supplementary light, with a high CRI for plant inspection, if the colouration of the plants is important.
Horticultural/Plant/Grow Light Measurements
How then do we measure light used for horticultural (plant growing) applications?
|
| |
► Lighting for plants is different from lighting for humans. Light energy for humans is
measured in lumens, with light falling onto a surface measured as illuminance with units of lux
(lumens per square meter) or footcandles (lumens per square foot).
► Light energy for plants, on the other hand, is measured as Photosynthetic Active Radiation (PAR),
with light per second falling onto a surface measured as Photosynthetic Photon Flux Density (PPFD)[8].
|
|
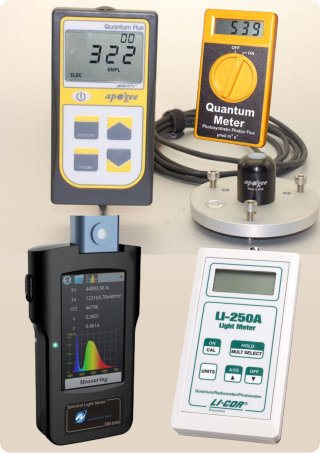
As we can see from the above quotation, the basic unit of measurement for plant/grow light output is PAR
(Photosynthetically Active Radiation). PAR is measured using a quantum flux meter[7], which
has an almost flat response curve between 400nm and 700nm, and is a measure of the Micromoles per
square meter, per second falling on the plants (µmol/M2/S ). The photo on the right shows some example PAR meters.
When it comes to measuring overall intensity of the light falling onto the plants, the unit of measurement is PPFD
(Photosynthetic Photon Flux Density), also measured in Micromoles per square meter per second (µmol/M2/S). This
is an important measurement as it allows us to show the overall efficiency of a plant/grow lights in PPFD/Watt (although the
best unit for determining overall electrical efficiency of grow-lights is µmol/J.
As shown by Dr. McCree, photon-weighted PPFD is a better predictor of photosynthesis when light sources with different
spectral power distributions are considered. Given this, PPFD is the metric most commonly used by horticulturalists [9].
|
 |
|
Another important, but less used, measurement is the Daily Light Integral (DLI)[5]. The DLI is defined as the
amount of PAR (PPFD) received by plants each day as a function of light intensity (instantaneous light: µmol/m2/s-1)
and duration (day). It is expressed as moles of light (mol) per square meter (m-2) per day (d-1), or: mol/m2/d-1 (moles per day).
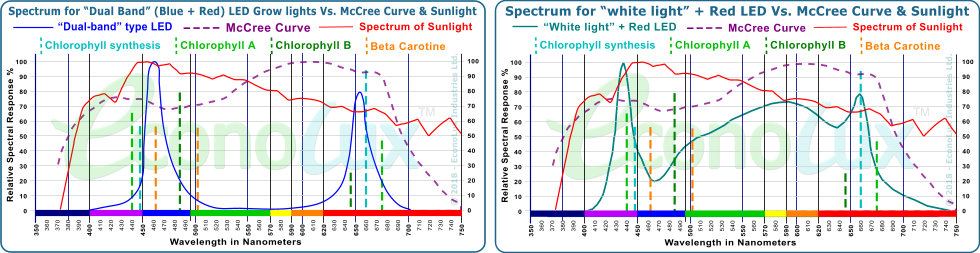
Spectrum Comparisons
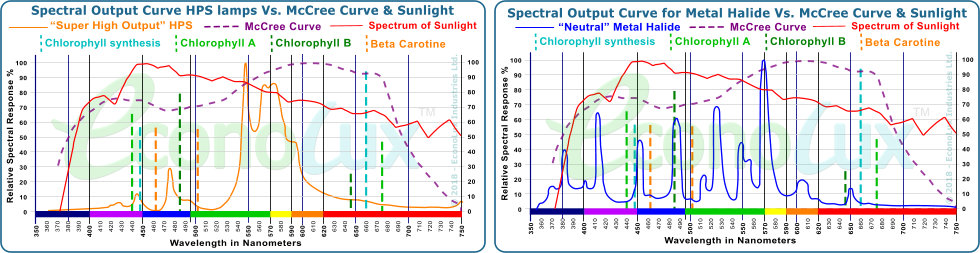
Comparison of the spectrum of typical HPS and Metal Halide grow-lights
(above), and typical Blue + Red LED and "Modifies white
light" (White + Red LEDs) type grow-lights (below), to
the McCree curve and the spectrum of Sunlight. As you can
see, none of them are a close match.
SUMMARY
To summarize the major points we have learned in this
article, plants need light energy as the major driving force of photosynthesis, the process
whereby they convert CO2 into oxygen and food. The lighting needs of plants are complex and go well beyond the
spectrum that simple Blue + Red or 'White light' LED grow-lights can provide
(although plants will grow under those types of lights).
While the PAR curve provides some basic insight into the lighting spectrum that plants need, the extensive research by
Keith. J. McCree, which resulted in the McCree curve, shows that plants need a full spectrum of light from 380nm to
750nm in order to thrive under artificial lighting. Dr. McCree also showed that PPFD is the best way to measure light
levels for plants, as PPFD is the best predictor of the rate of photosynthesis.
|
|
References:
NOTE: Links to website provided in the references were current at time of publication. Due to the
nature of the Internet, these links may have changed.
[1] "Photosynthetically Active Radiation (PAR) is defined as the photons of radiation in the 400nm to 700nm
waveband. PAR is a general term that can describe either the photosynthetic photon flux density (PPF), or the
photosynthetic irradiance (PI)." - Plant Physiology: Manipulating Plant Growth with Solar Radiation - Dennis
Decoteau, Ph.D., Department of Horticulture, The Pennsylvania State University.
[2] "The energy contained in light is absorbed in the chlorophyll of plants. Not all wavelengths of
light are utilized with equal efficiency. Looking at a chlorophyll/light absorption curve, one can deduce that
red and blue light are more effective than green. This is logical. Plants do not use all of the green light.
They reflect it. This is why plants appear green." - Wayne Vandre
- Fluorescent Lights For
Plant Growth - University Of Alaska, Fairbanks.
[3] "The action spectrum, absorptance and quantum yield of photosynthesis in crop plants" - McCree, Keith J.
Agricultural and Forest Meteorology 9: 191-216. doi:10.1016/0002-1571(71)90022-7
[4] "Why Are Plants Green? To Reduce the Noise in Photosynthesis. - Quieting a noisy antenna reproduces photosynthetic light-harvesting spectra -
Trevor B. Arp, Kistner-Morris, Vivek Aji, Richard J. Cogdell, Rienk van Grondelle, and Nathaniel M. Gabor -
Science 26 Jun 2020: Vol. 368, Issue 6498, pp. 1490-1495 - DOI: 10.1126/science.aba6630
[4A] "Life Under The Sun" by Peter A. Ensminger, Yale University Press (March 1, 2001)
[5] DLI Definition from "Measuring Daily Light Integral in a Greenhouse"
- Ariana P. Torres and Roberto G. Lopez;
Department of Horticulture and Landscape Architecture, Purdue University - http://www.extension.purdue.edu/extmedia/ho/ho-238-w.pdf
[6] Judd, D. B. (1951). Report of U.S. Secretariat Committee on Colorimetry and Artificial Daylight. In Proceedings
of the Twelfth Session of the CIE, Stockholm (vol. 1, pp. 11). Paris: Bureau Central de la CIE.
[7] Examples of PAR meters are those made by Apogee Instruments Inc. - http://www.apogeeinstruments.com/quantum/ or those
made by Li-Cor - https://www.licor.com/env/products/light/ to give two popular examples.
[8] "Light energy for plants, on the other hand, is measured as Photosynthetic Active Radiation (PAR), with light
per second falling onto a surface measured as Photosynthetic Photon Flux Density (PPFD)." -
http://docs.agi32.com/AGi32/Content/adding_calculation_points/PPFD_Concepts.htm
[9] Photometry and Photosynthesis: From Photometry to PPFD
(Revised). Available from: https://www.researchgate.net/publication/284157299_Photometry_and_Photosynthesis_From_Photometry_to_PPFD_Revised
|
 |
-
DOWNLOAD - What Light
Do Plants Need? - June 2018.pdf
|